Guide to Using the Break-even Analysis Template
Introduction
Welcome to our break-even analysis tool! This spreadsheet is designed to help projects, business owners and entrepreneurs understand at what point their business will be able to cover all expenses with the revenue generated. The template includes several sheets: Assumptions, Calculation, Results, and an Intro page.
Navigating the Spreadsheet
Assumptions Sheet:
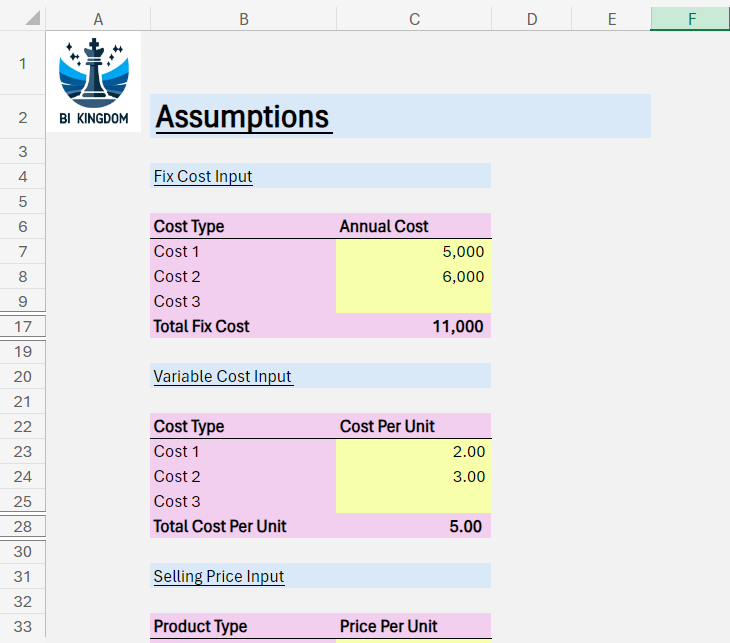
On the ‘Assumptions’ sheet, you will find cells highlighted in yellow. These cells are editable and should be filled in with your specific business data:
- Fix Cost Input: Describe each yearly fix cost.
- Variable Cost Input: Input the variable cost per unit. Updating these values will automatically adjust the calculations across the spreadsheet.
- Selling Price Input: Input the selling price per unit.
Calculation Sheet:
This sheet is locked as it contains the formulas used to compute your break-even point based on your inputs from the ‘Assumptions’ sheet. Please review to understand the computations but avoid altering any content to ensure the accuracy of your analysis.
Results Sheet:
The ‘Results’ sheet displays the calculated data such as your total fixed costs and the gross profit per unit. These fields update dynamically as you modify the ‘Assumptions’ sheet.
Using the Results
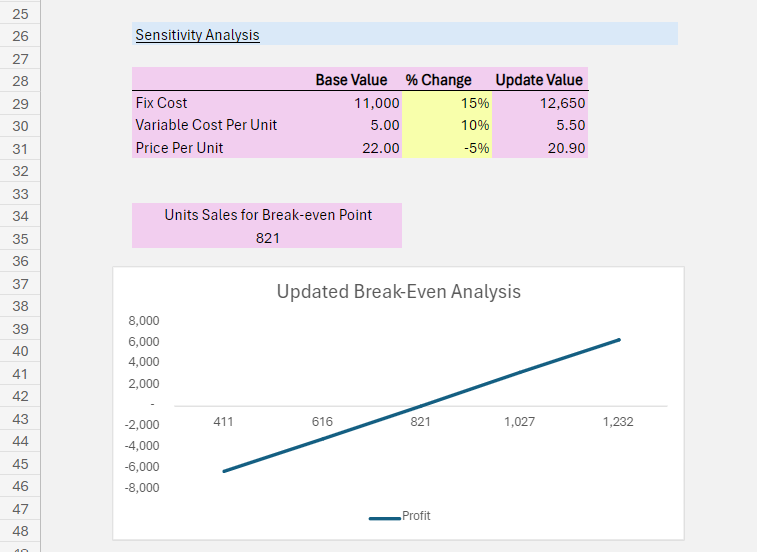
The results from this template will help you identify the number of units you need to sell to break even. Use these insights to plan your pricing strategies and cost management. For instance, reducing fixed costs or increasing the price per unit can lower your break-even point, making your business profitable sooner.
FAQs
- What if my expenses vary month to month?
- Try to estimate an average or use the highest expected costs to ensure you’re covered during peak times.
- Who can I contact if I need help with the template?
- For further assistance, please contact office@bi-kingdom.com , and we’ll get back to you as soon as possible.


